import pandas as pd
import numpy as np
# we are using the inline backend
%matplotlib inline
import matplotlib as mpl
import matplotlib.pyplot as plt
import seaborn as snsdf=pd.read_csv('SOSNEW.csv')df.drop('Unnamed: 0',axis=1,inplace=True)df| Datetime | Tweet Id | Text | Username | Displayname | Location | date | Ahmedabad | Bangalore | Bengaluru | ... | Kashmir | Maharashtra | Madhya Pradesh | Mumbai | Pune | Punjab | Rajasthan | Tamil Nadu | Uttar Pradesh | West Bengal | |
|---|---|---|---|---|---|---|---|---|---|---|---|---|---|---|---|---|---|---|---|---|---|
| 0 | 2021-03-26 03:10:48+00:00 | 1375284068368084994 | 3.5 years on, \nlooks like,,, \nnow, “#homebuy... | CaptMrinalC | Capt Mrinal🇮🇳 | New Delhi | 2021-03-26 | False | False | False | ... | False | False | False | False | False | False | False | False | False | False |
| 1 | 2021-03-25 17:25:20+00:00 | 1375136733231112197 | #urgently looking for 'canglobe p' injection v... | swapcoolkarni | Swapnil Kulkarni | India | Bharat | Hindustan | 2021-03-25 | False | False | False | ... | False | False | False | False | False | False | False | False | False | False |
| 2 | 2021-03-24 14:29:12+00:00 | 1374730018631294978 | the 2020 total lockdown with 3 covid cases was... | paarvinder | Dr. Parvinder Singh | Ludhiana, India | 2021-03-24 | False | False | False | ... | False | False | False | False | False | False | False | False | False | False |
| 3 | 2021-03-19 09:37:15+00:00 | 1372844607914971139 | #sos\nhelping a friend.\nanyone who can direct... | PLHIV_angelrafa | Angel Raphael Colins | Republic of the Philippines | 2021-03-19 | False | False | False | ... | False | False | False | False | False | False | False | False | False | False |
| 4 | 2021-03-14 05:31:31+00:00 | 1370970830054682628 | @thanecitypolice @thane_r_police @tmcatweetawa... | RomeshSankhe | The Observer_RSAS | रोमेश श्रीकांत अनुसया संखे | मुंबई, महाराष्ट्र, भारत | 2021-03-14 | False | False | False | ... | False | False | False | False | False | False | False | False | False | False |
| ... | ... | ... | ... | ... | ... | ... | ... | ... | ... | ... | ... | ... | ... | ... | ... | ... | ... | ... | ... | ... | ... |
| 39096 | 2021-04-22 19:51:59+00:00 | 1385320496950956033 | #ahmedabad #sosahmedabad https://t.co/pcdoiwvea3 | vatvatma | Saurabh | Redmond, WA | 2021-04-22 | True | False | False | ... | False | False | False | False | False | False | False | False | False | False |
| 39097 | 2021-04-22 16:46:19+00:00 | 1385273772941488130 | #sos #sosahmedabad \n@sonusood @varungrover\n@... | SohelMemon22 | Sohel Memon | Ahmadabad City, Gujarat | 2021-04-22 | True | False | False | ... | False | False | False | False | False | False | False | False | False | False |
| 39098 | 2021-04-22 11:29:18+00:00 | 1385193992908771328 | #sosahmedabad https://t.co/t6ye30wgnn | swaruvsky | Bong Jo-Hoon 🇮🇳 | Howrah | 2021-04-22 | True | False | False | ... | False | False | False | False | False | False | False | False | False | False |
| 39099 | 2021-04-21 09:25:10+00:00 | 1384800366760398851 | @nainithaker @pub_neat #sosiyc #sosahmedabad | starmaaann | sifar | NaN | 2021-04-21 | True | False | False | ... | False | False | False | False | False | False | False | False | False | False |
| 39100 | 2021-04-19 17:38:17+00:00 | 1384199688283254784 | #sosahmedabad need six doses of #remedisivir v... | mohd_faizkhan | faiz | India | 2021-04-19 | True | False | False | ... | False | False | False | False | False | False | False | False | False | False |
39101 rows × 26 columns
df['Tamil Nadu Total']=df['Chennai']+df['Tamil Nadu']df['Tamil Nadu Total'].value_counts()False 38442
True 659
Name: Tamil Nadu Total, dtype: int64df['Jammu Kashmir']=df['JK']+df['Kashmir']df['MP Total']=df['Bhopal']+df['Madhya Pradesh']df['MH Total']=df['Maharashtra']+df['Mumbai']+df['Pune']df['Bangalore Total']=df['Bangalore']+df['Bengaluru']df['GJ Total']=df['Gujarat']+df['Ahmedabad']df| Datetime | Tweet Id | Text | Username | Displayname | Location | date | Ahmedabad | Bangalore | Bengaluru | ... | Rajasthan | Tamil Nadu | Uttar Pradesh | West Bengal | Tamil Nadu Total | Jammu Kashmir | MP Total | MH Total | Bangalore Total | GJ Total | |
|---|---|---|---|---|---|---|---|---|---|---|---|---|---|---|---|---|---|---|---|---|---|
| 0 | 2021-03-26 03:10:48+00:00 | 1375284068368084994 | 3.5 years on, \nlooks like,,, \nnow, “#homebuy... | CaptMrinalC | Capt Mrinal🇮🇳 | New Delhi | 2021-03-26 | False | False | False | ... | False | False | False | False | False | False | False | False | False | False |
| 1 | 2021-03-25 17:25:20+00:00 | 1375136733231112197 | #urgently looking for 'canglobe p' injection v... | swapcoolkarni | Swapnil Kulkarni | India | Bharat | Hindustan | 2021-03-25 | False | False | False | ... | False | False | False | False | False | False | False | False | False | False |
| 2 | 2021-03-24 14:29:12+00:00 | 1374730018631294978 | the 2020 total lockdown with 3 covid cases was... | paarvinder | Dr. Parvinder Singh | Ludhiana, India | 2021-03-24 | False | False | False | ... | False | False | False | False | False | False | False | False | False | False |
| 3 | 2021-03-19 09:37:15+00:00 | 1372844607914971139 | #sos\nhelping a friend.\nanyone who can direct... | PLHIV_angelrafa | Angel Raphael Colins | Republic of the Philippines | 2021-03-19 | False | False | False | ... | False | False | False | False | False | False | False | False | False | False |
| 4 | 2021-03-14 05:31:31+00:00 | 1370970830054682628 | @thanecitypolice @thane_r_police @tmcatweetawa... | RomeshSankhe | The Observer_RSAS | रोमेश श्रीकांत अनुसया संखे | मुंबई, महाराष्ट्र, भारत | 2021-03-14 | False | False | False | ... | False | False | False | False | False | False | False | False | False | False |
| ... | ... | ... | ... | ... | ... | ... | ... | ... | ... | ... | ... | ... | ... | ... | ... | ... | ... | ... | ... | ... | ... |
| 39096 | 2021-04-22 19:51:59+00:00 | 1385320496950956033 | #ahmedabad #sosahmedabad https://t.co/pcdoiwvea3 | vatvatma | Saurabh | Redmond, WA | 2021-04-22 | True | False | False | ... | False | False | False | False | False | False | False | False | False | True |
| 39097 | 2021-04-22 16:46:19+00:00 | 1385273772941488130 | #sos #sosahmedabad \n@sonusood @varungrover\n@... | SohelMemon22 | Sohel Memon | Ahmadabad City, Gujarat | 2021-04-22 | True | False | False | ... | False | False | False | False | False | False | False | False | False | True |
| 39098 | 2021-04-22 11:29:18+00:00 | 1385193992908771328 | #sosahmedabad https://t.co/t6ye30wgnn | swaruvsky | Bong Jo-Hoon 🇮🇳 | Howrah | 2021-04-22 | True | False | False | ... | False | False | False | False | False | False | False | False | False | True |
| 39099 | 2021-04-21 09:25:10+00:00 | 1384800366760398851 | @nainithaker @pub_neat #sosiyc #sosahmedabad | starmaaann | sifar | NaN | 2021-04-21 | True | False | False | ... | False | False | False | False | False | False | False | False | False | True |
| 39100 | 2021-04-19 17:38:17+00:00 | 1384199688283254784 | #sosahmedabad need six doses of #remedisivir v... | mohd_faizkhan | faiz | India | 2021-04-19 | True | False | False | ... | False | False | False | False | False | False | False | False | False | True |
39101 rows × 32 columns
df.info()<class 'pandas.core.frame.DataFrame'>
RangeIndex: 39101 entries, 0 to 39100
Data columns (total 32 columns):
# Column Non-Null Count Dtype
--- ------ -------------- -----
0 Datetime 39101 non-null object
1 Tweet Id 39101 non-null int64
2 Text 39101 non-null object
3 Username 39101 non-null object
4 Displayname 39101 non-null object
5 Location 30535 non-null object
6 date 39101 non-null object
7 Ahmedabad 39101 non-null bool
8 Bangalore 39101 non-null bool
9 Bengaluru 39101 non-null bool
10 Bhopal 39101 non-null bool
11 Bihar 39101 non-null bool
12 Chennai 39101 non-null bool
13 Delhi 39101 non-null bool
14 Gujarat 39101 non-null bool
15 JK 39101 non-null bool
16 Kashmir 39101 non-null bool
17 Maharashtra 39101 non-null bool
18 Madhya Pradesh 39101 non-null bool
19 Mumbai 39101 non-null bool
20 Pune 39101 non-null bool
21 Punjab 39101 non-null bool
22 Rajasthan 39101 non-null bool
23 Tamil Nadu 39101 non-null bool
24 Uttar Pradesh 39101 non-null bool
25 West Bengal 39101 non-null bool
26 Tamil Nadu Total 39101 non-null bool
27 Jammu Kashmir 39101 non-null bool
28 MP Total 39101 non-null bool
29 MH Total 39101 non-null bool
30 Bangalore Total 39101 non-null bool
31 GJ Total 39101 non-null bool
dtypes: bool(25), int64(1), object(6)
memory usage: 3.0+ MBdf.rename({'Gujarat': 'GJ', 'Maharashtra': 'MH','Madhya Pradesh':'MP','Tamil Nadu':'TN'}, axis=1,inplace=True)df.rename({'GJ Total': 'Gujrat', 'MH Total': 'Maharashtra','MP Total':'Madhya Pradesh','Tamil Nadu Total':'Tamil Nadu'}, axis=1,inplace=True)df.rename({'Bangalore Total':'Karnataka'}, axis=1,inplace=True)df.info()<class 'pandas.core.frame.DataFrame'>
RangeIndex: 39101 entries, 0 to 39100
Data columns (total 32 columns):
# Column Non-Null Count Dtype
--- ------ -------------- -----
0 Datetime 39101 non-null object
1 Tweet Id 39101 non-null int64
2 Text 39101 non-null object
3 Username 39101 non-null object
4 Displayname 39101 non-null object
5 Location 30535 non-null object
6 date 39101 non-null object
7 Ahmedabad 39101 non-null bool
8 Bangalore 39101 non-null bool
9 Bengaluru 39101 non-null bool
10 Bhopal 39101 non-null bool
11 Bihar 39101 non-null bool
12 Chennai 39101 non-null bool
13 Delhi 39101 non-null bool
14 GJ 39101 non-null bool
15 JK 39101 non-null bool
16 Kashmir 39101 non-null bool
17 MH 39101 non-null bool
18 MP 39101 non-null bool
19 Mumbai 39101 non-null bool
20 Pune 39101 non-null bool
21 Punjab 39101 non-null bool
22 Rajasthan 39101 non-null bool
23 TN 39101 non-null bool
24 Uttar Pradesh 39101 non-null bool
25 West Bengal 39101 non-null bool
26 Tamil Nadu 39101 non-null bool
27 Jammu Kashmir 39101 non-null bool
28 Madhya Pradesh 39101 non-null bool
29 Maharashtra 39101 non-null bool
30 Karnataka 39101 non-null bool
31 Gujrat 39101 non-null bool
dtypes: bool(25), int64(1), object(6)
memory usage: 3.0+ MBstates=['Bihar','Delhi','Gujrat','Punjab','Rajasthan','Uttar Pradesh','West Bengal','Tamil Nadu',
'Jammu Kashmir','Madhya Pradesh','Maharashtra','Karnataka']dfStates=df[states]df['date'] = pd.to_datetime(df['Datetime'])
df.info()<class 'pandas.core.frame.DataFrame'>
RangeIndex: 39101 entries, 0 to 39100
Data columns (total 32 columns):
# Column Non-Null Count Dtype
--- ------ -------------- -----
0 Datetime 39101 non-null object
1 Tweet Id 39101 non-null int64
2 Text 39101 non-null object
3 Username 39101 non-null object
4 Displayname 39101 non-null object
5 Location 30535 non-null object
6 date 39101 non-null datetime64[ns, UTC]
7 Ahmedabad 39101 non-null bool
8 Bangalore 39101 non-null bool
9 Bengaluru 39101 non-null bool
10 Bhopal 39101 non-null bool
11 Bihar 39101 non-null bool
12 Chennai 39101 non-null bool
13 Delhi 39101 non-null bool
14 GJ 39101 non-null bool
15 JK 39101 non-null bool
16 Kashmir 39101 non-null bool
17 MH 39101 non-null bool
18 MP 39101 non-null bool
19 Mumbai 39101 non-null bool
20 Pune 39101 non-null bool
21 Punjab 39101 non-null bool
22 Rajasthan 39101 non-null bool
23 TN 39101 non-null bool
24 Uttar Pradesh 39101 non-null bool
25 West Bengal 39101 non-null bool
26 Tamil Nadu 39101 non-null bool
27 Jammu Kashmir 39101 non-null bool
28 Madhya Pradesh 39101 non-null bool
29 Maharashtra 39101 non-null bool
30 Karnataka 39101 non-null bool
31 Gujrat 39101 non-null bool
dtypes: bool(25), datetime64[ns, UTC](1), int64(1), object(5)
memory usage: 3.0+ MBmpl.style.use(['seaborn-darkgrid'])
df['date'] = df['date'].dt.date
df.groupby(by='date').size().plot(figsize=(20,10))
plt.title('Number Of Tweets during Second Wave')
plt.ylabel('Number of Tweets')
plt.xlabel('Date')
plt.show()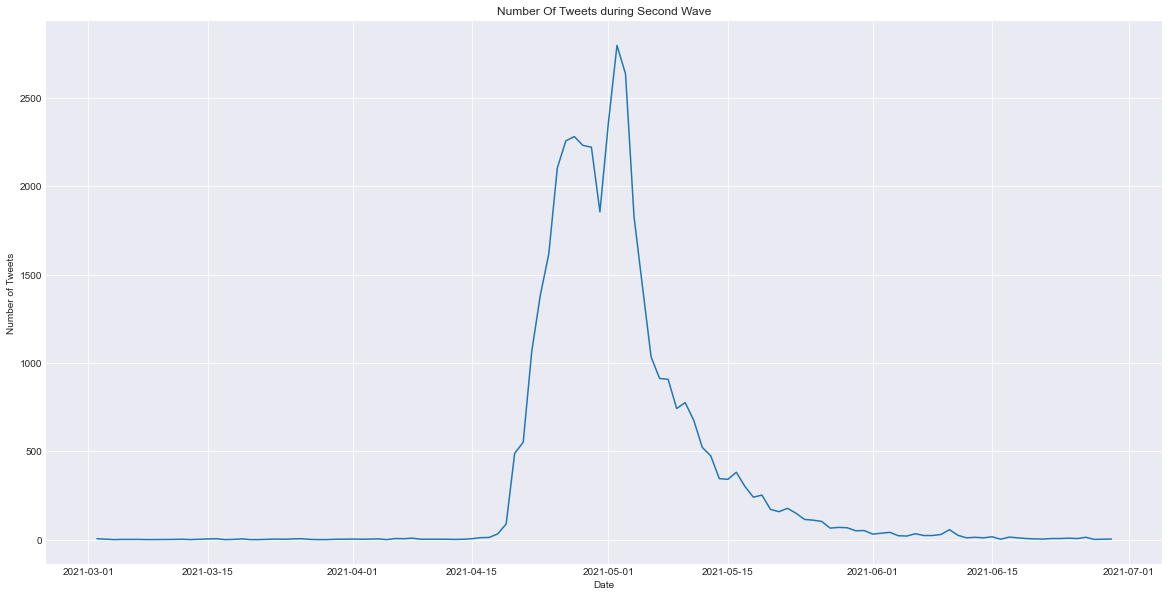
data=[]
dfNew = pd.DataFrame(data, columns=dfStates.columns)
dfNew| Bihar | Delhi | Gujrat | Punjab | Rajasthan | Uttar Pradesh | West Bengal | Tamil Nadu | Jammu Kashmir | Madhya Pradesh | Maharashtra | Karnataka |
|---|
dfStates=dfStates.astype(int)data=[0]
dfNew=dfNew.append(data)C:\Users\Acer\AppData\Local\Temp\ipykernel_8084\241412925.py:2: FutureWarning: The frame.append method is deprecated and will be removed from pandas in a future version. Use pandas.concat instead.
dfNew=dfNew.append(data)dfNew| Bihar | Delhi | Gujrat | Punjab | Rajasthan | Uttar Pradesh | West Bengal | Tamil Nadu | Jammu Kashmir | Madhya Pradesh | Maharashtra | Karnataka | 0 | |
|---|---|---|---|---|---|---|---|---|---|---|---|---|---|
| 0 | NaN | NaN | NaN | NaN | NaN | NaN | NaN | NaN | NaN | NaN | NaN | NaN | 0.0 |
dfNew = dfNew.drop(dfNew.columns[[12]], axis=1)dfNew| Bihar | Delhi | Gujrat | Punjab | Rajasthan | Uttar Pradesh | West Bengal | Tamil Nadu | Jammu Kashmir | Madhya Pradesh | Maharashtra | Karnataka | |
|---|---|---|---|---|---|---|---|---|---|---|---|---|
| 0 | NaN | NaN | NaN | NaN | NaN | NaN | NaN | NaN | NaN | NaN | NaN | NaN |
dfStates| Bihar | Delhi | Gujrat | Punjab | Rajasthan | Uttar Pradesh | West Bengal | Tamil Nadu | Jammu Kashmir | Madhya Pradesh | Maharashtra | Karnataka | |
|---|---|---|---|---|---|---|---|---|---|---|---|---|
| 0 | 0 | 0 | 0 | 0 | 0 | 0 | 0 | 0 | 0 | 0 | 0 | 0 |
| 1 | 0 | 0 | 0 | 0 | 0 | 0 | 0 | 0 | 0 | 0 | 0 | 0 |
| 2 | 0 | 0 | 0 | 0 | 0 | 0 | 0 | 0 | 0 | 0 | 0 | 0 |
| 3 | 0 | 0 | 0 | 0 | 0 | 0 | 0 | 0 | 0 | 0 | 0 | 0 |
| 4 | 0 | 0 | 0 | 0 | 0 | 0 | 0 | 0 | 0 | 0 | 0 | 0 |
| ... | ... | ... | ... | ... | ... | ... | ... | ... | ... | ... | ... | ... |
| 39096 | 0 | 0 | 1 | 0 | 0 | 0 | 0 | 0 | 0 | 0 | 0 | 0 |
| 39097 | 0 | 0 | 1 | 0 | 0 | 0 | 0 | 0 | 0 | 0 | 0 | 0 |
| 39098 | 0 | 0 | 1 | 0 | 0 | 0 | 0 | 0 | 0 | 0 | 0 | 0 |
| 39099 | 0 | 0 | 1 | 0 | 0 | 0 | 0 | 0 | 0 | 0 | 0 | 0 |
| 39100 | 0 | 0 | 1 | 0 | 0 | 0 | 0 | 0 | 0 | 0 | 0 | 0 |
39101 rows × 12 columns
for column in dfStates:
    res=dfStates[column].sum()
    dfNew[column][0]=res
    print(res)
844
24177
303
129
193
60
13
659
2789
852
3009
3251dfNew| Bihar | Delhi | Gujrat | Punjab | Rajasthan | Uttar Pradesh | West Bengal | Tamil Nadu | Jammu Kashmir | Madhya Pradesh | Maharashtra | Karnataka | |
|---|---|---|---|---|---|---|---|---|---|---|---|---|
| 0 | 844 | 24177 | 303 | 129 | 193 | 60 | 13 | 659 | 2789 | 852 | 3009 | 3251 |
dfNew=dfNew.transpose()dfTotal = dfNew.rename(columns={dfNew.columns[0]: 'Total'})mpl.style.use(['seaborn-darkgrid'])
dfTotal.plot(kind='bar',figsize=(15,10))
plt.title('Number Of Tweets during Second Wave',fontsize=18 )
plt.ylabel('Number of Tweets', fontsize=18)
plt.xticks(fontsize=14)
plt.yticks(fontsize=14)
plt.xlabel('States',fontsize=18)
plt.savefig('TweetsFromStates.png')
plt.show()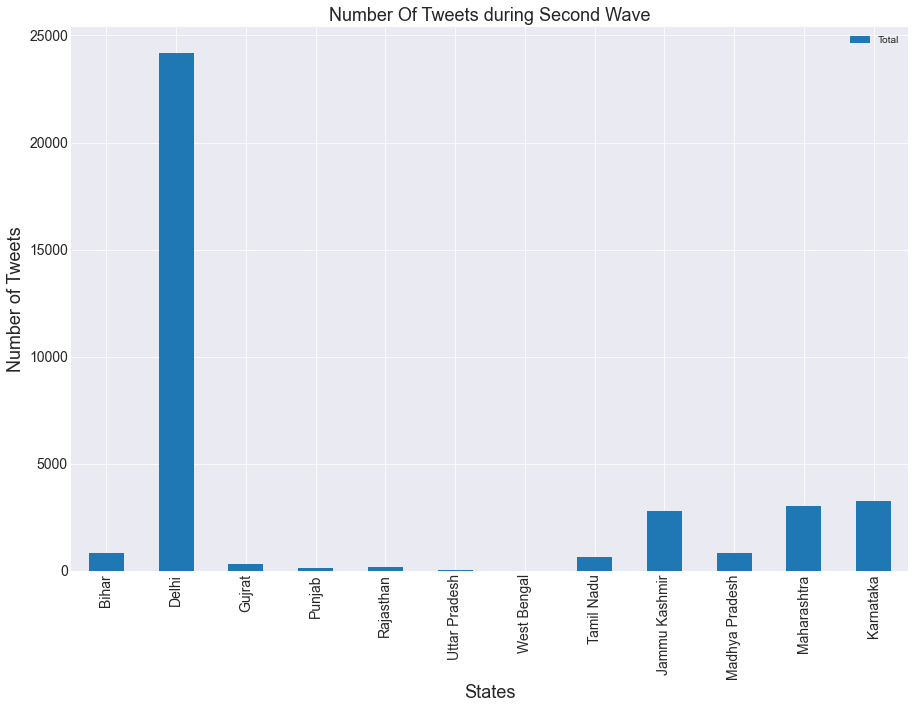
dfTotal['GDP']=NonedfTotal['GDP'][0]=80dfTotal['GDP'][1]=117
dfTotal['GDP'][2]=230
dfTotal['GDP'][3]=80
dfTotal['GDP'][4]=143
dfTotal['GDP'][5]=240
dfTotal['GDP'][6]=165
dfTotal['GDP'][7]=247
dfTotal['GDP'][8]=24
dfTotal['GDP'][9]=123
dfTotal['GDP'][10]=400
dfTotal['GDP'][11]=227
dfTotal| Total | GDP | |
|---|---|---|
| Bihar | 844 | 100 |
| Delhi | 24177 | 117 |
| Gujrat | 303 | 230 |
| Punjab | 129 | 80 |
| Rajasthan | 193 | 143 |
| Uttar Pradesh | 60 | 240 |
| West Bengal | 13 | 165 |
| Tamil Nadu | 659 | 247 |
| Jammu Kashmir | 2789 | 24 |
| Madhya Pradesh | 852 | 123 |
| Maharashtra | 3009 | 400 |
| Karnataka | 3251 | 227 |
#fig, ax = plt.subplots()
ax=dfTotal.plot(kind='bar',figsize=(15,10),width=0.8 )
plt.rc('legend',fontsize=20)
# for index, value in enumerate(dfTotal['GDP']):
#     plt.text(value, index,str(value))
plt.title('Number Of Tweets during Second Wave VS GDP',fontsize=18)
plt.ylabel('Number of Tweets and GDP in Billion $', fontsize=18)
plt.xticks(fontsize=14)
plt.yticks(fontsize=14)
plt.legend(labels=['Total Tweets','GDP in Billion $'])

plt.xlabel('States',fontsize=18)
# ax.bar_label(ax.containers[0],ax.containers[1])
for c in ax.containers:
    ax.bar_label(c, fmt='%.0f', label_type='edge')
plt.tight_layout()
plt.savefig('TweetsVsGDP1.jpg')

plt.show()

# x = [u'INFO', u'CUISINE', u'TYPE_OF_PLACE', u'DRINK', u'PLACE', u'MEAL_TIME', u'DISH', u'NEIGHBOURHOOD']
# y = [160, 167, 137, 18, 120, 36, 155, 130]
# ind = np.arange(len(y))

# fig, ax = plt.subplots()
# ax.barh(ind, y)
# ax.set_yticks(ind)
# ax.set_yticklabels(x)

# # new helper method to auto-label bars
# ax.bar_label(ax.containers[0])
# !pip install matplotlib==3.4.0

# import matplotlib
# matplotlib.__version__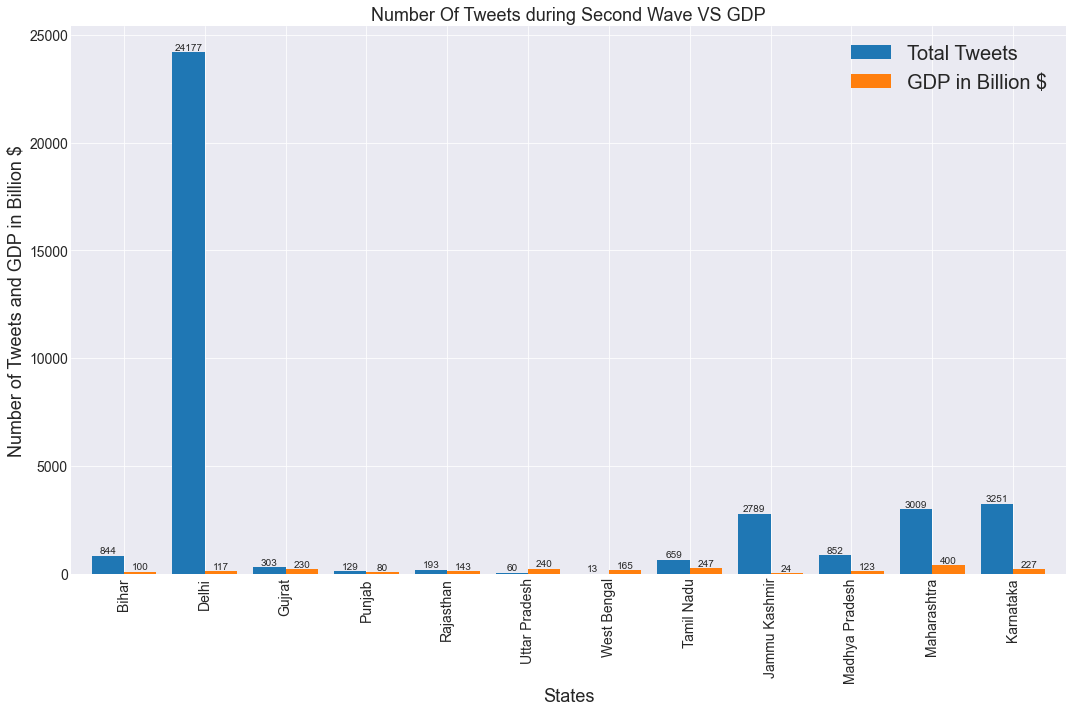
mpl.style.use(['seaborn-darkgrid'])


dfTotal['GDP'].plot(kind='bar',figsize=(15,10))
plt.title('GDP of Indian States',fontsize=18 )
plt.ylabel('GDP', fontsize=18)
plt.xticks(fontsize=14)
plt.yticks(fontsize=14)

plt.xlabel('States',fontsize=18)
# plt.savefig('GDPOfIndianStates.png')

# plt.show()
Text(0.5, 0, 'States')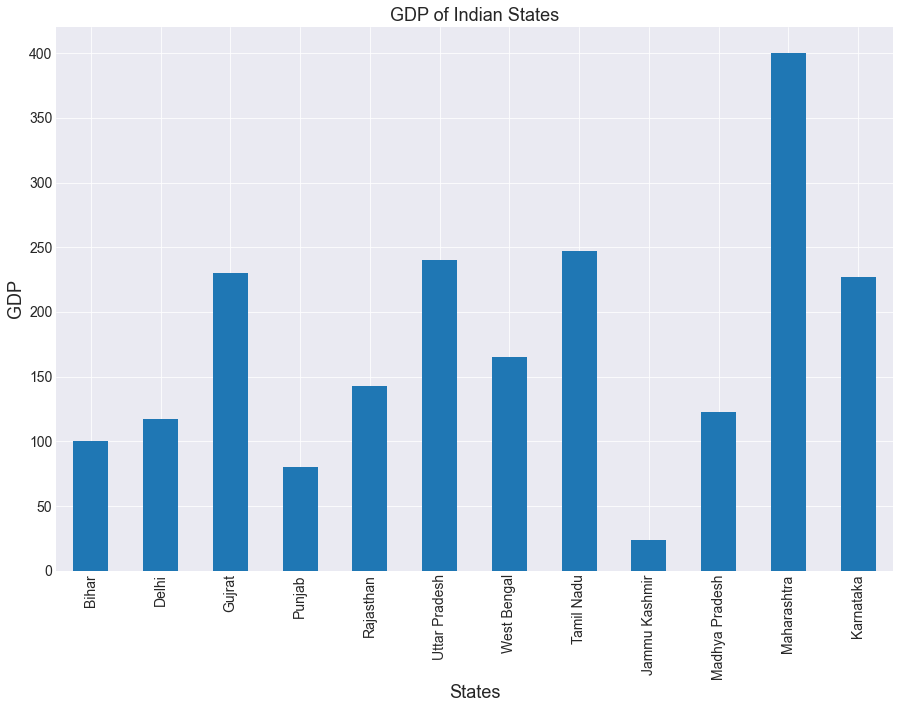
!pip install wordcloudCollecting wordcloud
Downloading wordcloud-1.8.2.2-cp39-cp39-win_amd64.whl (153 kB)
Requirement already satisfied: pillow in c:\users\acer\anaconda3\lib\site-packages (from wordcloud) (9.0.1)
Requirement already satisfied: numpy>=1.6.1 in c:\users\acer\anaconda3\lib\site-packages (from wordcloud) (1.21.5)
Requirement already satisfied: matplotlib in c:\users\acer\anaconda3\lib\site-packages (from wordcloud) (3.5.1)
Requirement already satisfied: python-dateutil>=2.7 in c:\users\acer\anaconda3\lib\site-packages (from matplotlib->wordcloud) (2.8.2)
Requirement already satisfied: kiwisolver>=1.0.1 in c:\users\acer\anaconda3\lib\site-packages (from matplotlib->wordcloud) (1.3.2)
Requirement already satisfied: pyparsing>=2.2.1 in c:\users\acer\anaconda3\lib\site-packages (from matplotlib->wordcloud) (3.0.4)
Requirement already satisfied: fonttools>=4.22.0 in c:\users\acer\anaconda3\lib\site-packages (from matplotlib->wordcloud) (4.25.0)
Requirement already satisfied: cycler>=0.10 in c:\users\acer\anaconda3\lib\site-packages (from matplotlib->wordcloud) (0.11.0)
Requirement already satisfied: packaging>=20.0 in c:\users\acer\anaconda3\lib\site-packages (from matplotlib->wordcloud) (21.3)
Requirement already satisfied: six>=1.5 in c:\users\acer\anaconda3\lib\site-packages (from python-dateutil>=2.7->matplotlib->wordcloud) (1.16.0)
Installing collected packages: wordcloud
Successfully installed wordcloud-1.8.2.2from wordcloud import WordCloud, STOPWORDSdfClean = df.Text.str.lower()
dfClean0 3.5 years on, \nlooks like,,, \nnow, “#homebuy...
1 #urgently looking for 'canglobe p' injection v...
2 the 2020 total lockdown with 3 covid cases was...
3 #sos\nhelping a friend.\nanyone who can direct...
4 @thanecitypolice @thane_r_police @tmcatweetawa...
...
39096 #ahmedabad #sosahmedabad https://t.co/pcdoiwvea3
39097 #sos #sosahmedabad \n@sonusood @varungrover\n@...
39098 #sosahmedabad https://t.co/t6ye30wgnn
39099 @nainithaker @pub_neat #sosiyc #sosahmedabad
39100 #sosahmedabad need six doses of #remedisivir v...
Name: Text, Length: 39101, dtype: objectimport re
dfClean = dfClean.apply(lambda x: re.sub(r'https?:\/\/\S+', '', x))
dfClean.apply(lambda x: re.sub(r"www\.[a-z]?\.?(com)+|[a-z]+\.(com)", '', x))
dfClean = dfClean.apply(lambda x: re.sub(r'{link}', '', x))
dfClean = dfClean.apply(lambda x: re.sub(r"\[video\]", '', x))
dfClean = dfClean.apply(lambda x: re.sub(r'&[a-z]+;', '', x))
dfClean = dfClean.apply(lambda x: re.sub(r"[^a-z\s\(\-:\)\\\/\];='#]", '', x))
dfClean = dfClean.apply(lambda x: re.sub(r'@mention', '', x))0 3.5 years on, \nlooks like,,, \nnow, “#homebuy...
1 #urgently looking for 'canglobe p' injection v...
2 the 2020 total lockdown with 3 covid cases was...
3 #sos\nhelping a friend.\nanyone who can direct...
4 @thanecitypolice @thane_r_police @tmcatweetawa...
...
39096 #ahmedabad #sosahmedabad
39097 #sos #sosahmedabad \n@sonusood @varungrover\n@...
39098 #sosahmedabad
39099 @nainithaker @pub_neat #sosiyc #sosahmedabad
39100 #sosahmedabad need six doses of #remedisivir v...
Name: Text, Length: 39101, dtype: objectdfClean0 years on \nlooks like \nnow #homebuyers being...
1 #urgently looking for 'canglobe p' injection v...
2 the total lockdown with covid cases was flau...
3 #sos\nhelping a friend\nanyone who can direct ...
4 thanecitypolice thanerpolice tmcatweetaway \n\...
...
39096 #ahmedabad #sosahmedabad
39097 #sos #sosahmedabad \nsonusood varungrover\nric...
39098 #sosahmedabad
39099 nainithaker pubneat #sosiyc #sosahmedabad
39100 #sosahmedabad need six doses of #remedisivir v...
Name: Text, Length: 39101, dtype: objectfrom PIL import Image, ImageDraw
!pip install pillowRequirement already satisfied: pillow in c:\users\acer\anaconda3\lib\site-packages (9.0.1)# Function to generate word cloud with dark red contour
rome_mask = np.array(Image.open('20489081.jpg'))
data=' '.join(dfClean)
def generate_better_wordcloud(data, title, mask=None):
cloud = WordCloud(scale=3,
max_words=150,
colormap='RdYlGn',
mask=mask,
background_color='white',
stopwords=stopwords,
collocations=True,
contour_color='#5d0f24',
contour_width=3).generate_from_text(data)
plt.figure(figsize=(15,10))
plt.imshow(cloud)
plt.axis('off')
plt.title(title)
plt.savefig('map.png')
plt.show()
# Use function to generate wordcloud
generate_better_wordcloud(data, 'Tweets During Covid19', mask=rome_mask)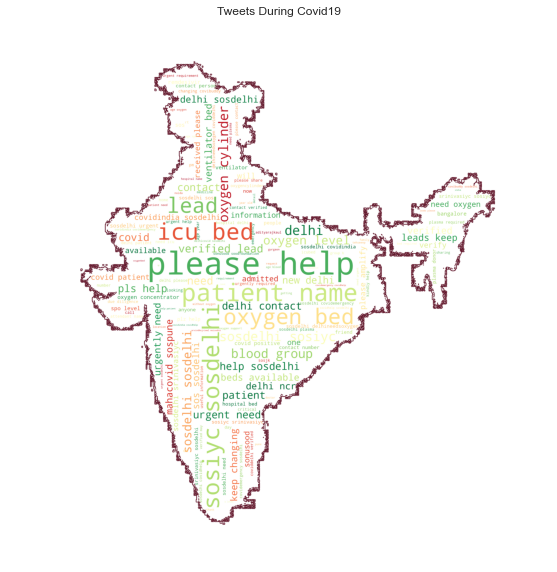
#A function to generate the word cloud from text
def generate_basic_wordcloud(data, title):
    cloud = WordCloud(width=400,
                      height=330,
                      max_words=150,
                      colormap='tab20c',
                      stopwords=stopwords,
                      collocations=True).generate_from_text(data)
    plt.figure(figsize=(15,10))
    plt.imshow(cloud)
    plt.axis('off')
    plt.title(title, fontsize=13)
    plt.show()

#Use the function to generate the word cloud
generate_basic_wordcloud(data, 'Tweets During Second Wave of COVID19')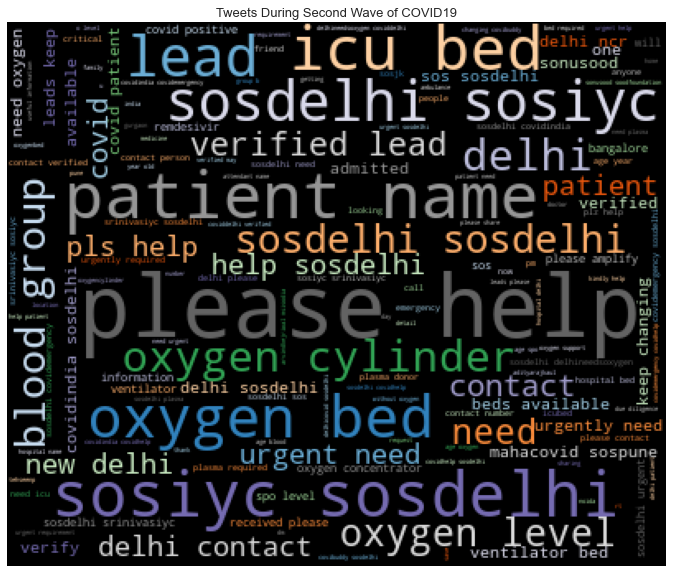
# dfTotaldfTotal['Health Care Spending']=None#https://prsindia.org/budgets/states/jammu-and-kashmir-budget-analysis-2018-19
#https://www.statista.com/statistics/685200/india-highest-public-health-expenditure-by-state/
health=[66.68,59.03,88.16,35.29,72.3,80.65,122.25,36.38,98.14,99.76,189.67,79.21]
for i,value in enumerate(health):
dfTotal['Health Care Spending'][i]=valuedfTotal| Total | GDP | Health Care Spending | |
|---|---|---|---|
| Bihar | 844 | 100 | 66.68 |
| Delhi | 24177 | 110 | 59.03 |
| Gujrat | 303 | 230 | 88.16 |
| Jammu Kashmir | 2789 | 23 | 35.29 |
| Karnataka | 3251 | 228 | 72.3 |
| Madhya Pradesh | 852 | 120 | 80.65 |
| Maharashtra | 3009 | 430 | 122.25 |
| Punjab | 129 | 72 | 36.38 |
| Rajasthan | 193 | 140 | 98.14 |
| Tamil Nadu | 659 | 297 | 99.76 |
| Uttar Pradesh | 60 | 240 | 189.67 |
| West Bengal | 13 | 181 | 79.21 |
dfTotal['Health Care per capita']=None
dfTotal['population']=None
#in millions
#https://www.indiatoday.in/education-today/gk-current-affairs/story/indian-states-with-highest-population-1358414-2018-10-08
population=[103.8,28.5,60.4,12.5,61.1,72.6,112.4,27.7,68.6,72.1,119.8,91.3]
for i,value in enumerate(population):
dfTotal['population'][i]=value
dfTotal['Health Care per capita'][i]=((dfTotal['Health Care Spending'][i])*1000)/(dfTotal['population'][i])dfTotal| Total | GDP | Health Care Spending | Health Care per capita | population | |
|---|---|---|---|---|---|
| Bihar | 844 | 100 | 66.68 | 642.38921 | 103.8 |
| Delhi | 24177 | 110 | 59.03 | 2071.22807 | 28.5 |
| Gujrat | 303 | 230 | 88.16 | 1459.602649 | 60.4 |
| Jammu Kashmir | 2789 | 23 | 35.29 | 2823.2 | 12.5 |
| Karnataka | 3251 | 228 | 72.3 | 1183.306056 | 61.1 |
| Madhya Pradesh | 852 | 120 | 80.65 | 1110.881543 | 72.6 |
| Maharashtra | 3009 | 430 | 122.25 | 1087.633452 | 112.4 |
| Punjab | 129 | 72 | 36.38 | 1313.357401 | 27.7 |
| Rajasthan | 193 | 140 | 98.14 | 1430.612245 | 68.6 |
| Tamil Nadu | 659 | 297 | 99.76 | 1383.633842 | 72.1 |
| Uttar Pradesh | 60 | 240 | 189.67 | 1583.222037 | 119.8 |
| West Bengal | 13 | 181 | 79.21 | 867.579409 | 91.3 |
dfTotal['Health Care Spending'].plot(kind='bar',figsize=(15,10))
plt.title('Healthcare Spending in Billion Rs',fontsize=18 )
plt.ylabel('Spending in Billiion Rs', fontsize=18)
plt.xticks(fontsize=14)
plt.yticks(fontsize=14)

plt.xlabel('States',fontsize=18)
# plt.savefig('HealthCareSpending.png')

# plt.show()
Text(0.5, 0, 'States')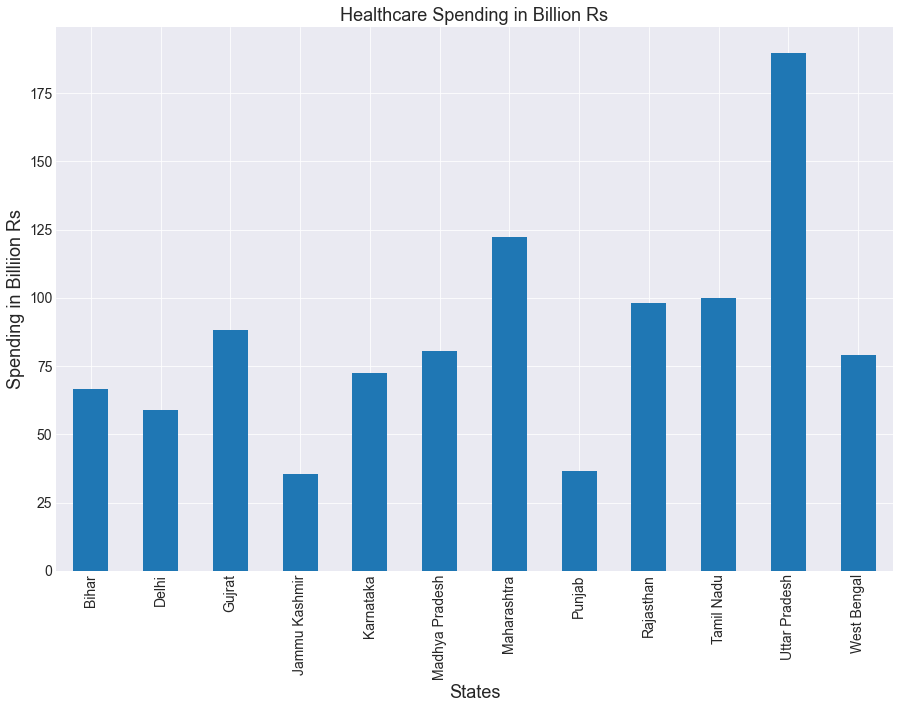
dfTotal['population'].plot(kind='bar',figsize=(15,10))
plt.title('Population of Indian States',fontsize=18 )
plt.ylabel('Population in millions', fontsize=18)
plt.xticks(fontsize=14)
plt.yticks(fontsize=14)

plt.xlabel('States',fontsize=18)
# plt.savefig('Population.png')

# plt.show()
Text(0.5, 0, 'States')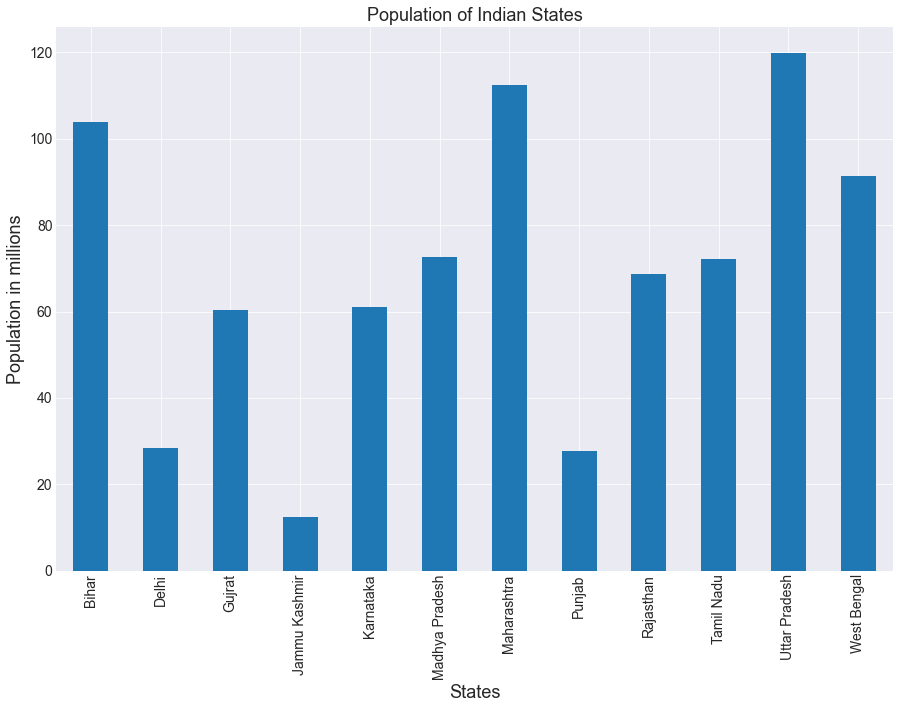
dfTotal['Health Care per capita'].plot(kind='bar',figsize=(15,10))
plt.title('HealthCare Spending of states per capita in Rs',fontsize=18 )
plt.ylabel('Spending in Rs', fontsize=18)
plt.xticks(fontsize=14)
plt.yticks(fontsize=14)

plt.xlabel('States',fontsize=18)
# plt.savefig('HealthCareperCapita.png')

# plt.show()
Text(0.5, 0, 'States')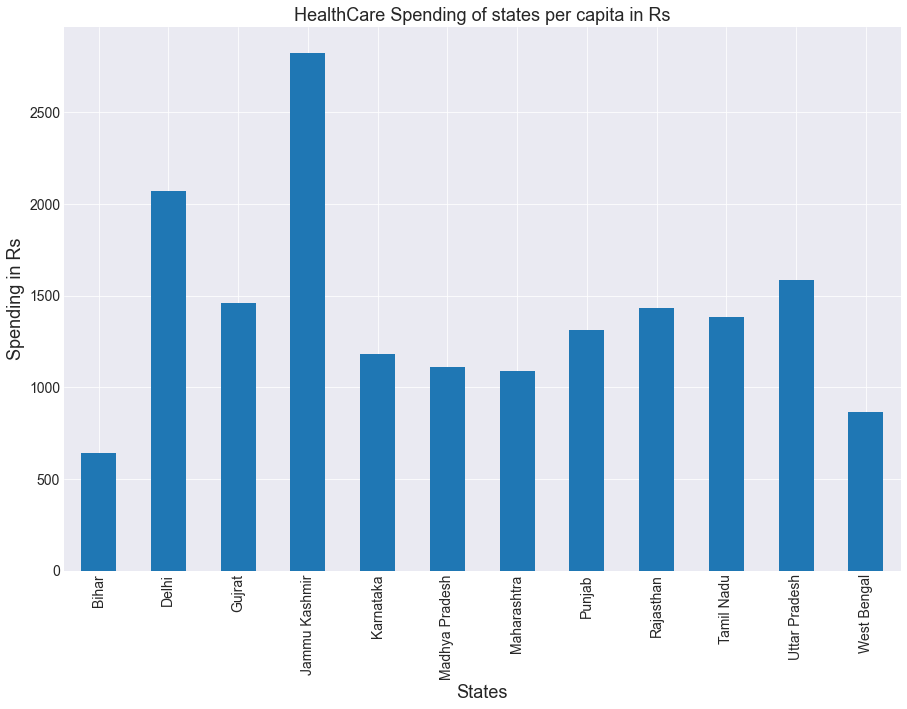
dfTotal[['Health Care per capita','Total']].plot(kind='bar',figsize=(15,10))
plt.title('HealthCare Spending Vs No of SOS Tweets during peak of Second Wave',fontsize=18 )
plt.ylabel('Spending vs Tweets', fontsize=18)
plt.xticks(fontsize=14)
plt.yticks(fontsize=14)

plt.xlabel('States',fontsize=18)
# plt.savefig('HealthCareperCapitavsTweets.png')

# plt.show()
Text(0.5, 0, 'States')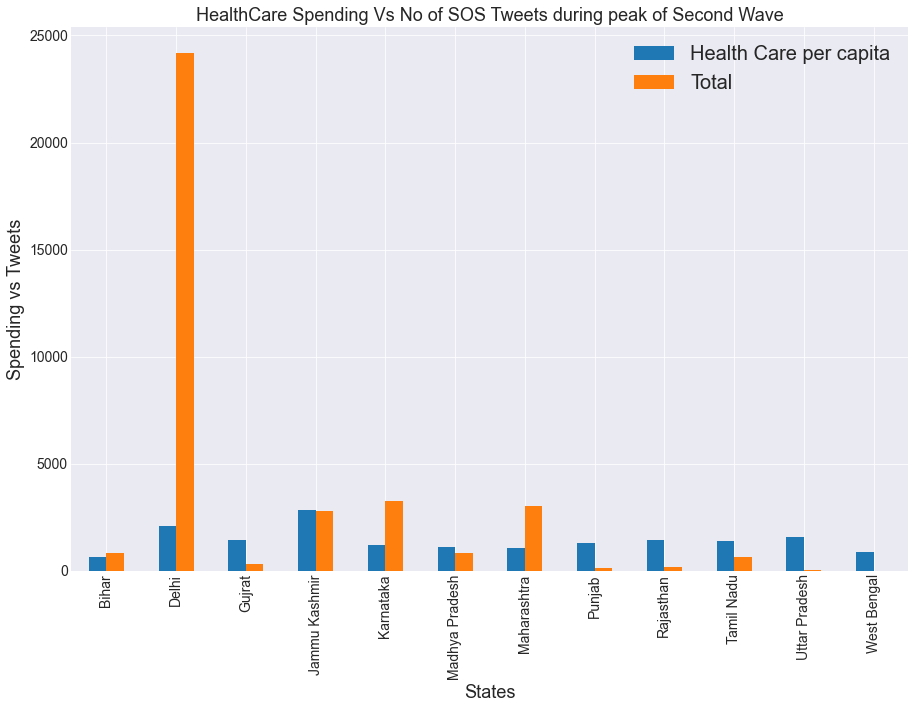
dfTotal['Internet Users Per 100']=None
dfTotal| Total | GDP | Health Care Spending | Health Care per capita | population | Internet Users Per 100 | |
|---|---|---|---|---|---|---|
| Bihar | 844 | 100 | 66.68 | 642.38921 | 103.8 | None |
| Delhi | 24177 | 110 | 59.03 | 2071.22807 | 28.5 | None |
| Gujrat | 303 | 230 | 88.16 | 1459.602649 | 60.4 | None |
| Jammu Kashmir | 2789 | 23 | 35.29 | 2823.2 | 12.5 | None |
| Karnataka | 3251 | 228 | 72.3 | 1183.306056 | 61.1 | None |
| Madhya Pradesh | 852 | 120 | 80.65 | 1110.881543 | 72.6 | None |
| Maharashtra | 3009 | 430 | 122.25 | 1087.633452 | 112.4 | None |
| Punjab | 129 | 72 | 36.38 | 1313.357401 | 27.7 | None |
| Rajasthan | 193 | 140 | 98.14 | 1430.612245 | 68.6 | None |
| Tamil Nadu | 659 | 297 | 99.76 | 1383.633842 | 72.1 | None |
| Uttar Pradesh | 60 | 240 | 189.67 | 1583.222037 | 119.8 | None |
| West Bengal | 13 | 181 | 79.21 | 867.579409 | 91.3 | None |
#https://www.trai.gov.in/sites/default/files/Report_09112020_0.pdf
internet=[30.99,199.98,64.79,55.23,69.35,44.24,74.72,84.32,53.79,65.68,38.73,51.74]
for i,value in enumerate(internet):
dfTotal['Internet Users Per 100'][i]=valuedfTotal| Total | GDP | Health Care Spending | Health Care per capita | population | Internet Users Per 100 | |
|---|---|---|---|---|---|---|
| Bihar | 844 | 100 | 66.68 | 642.38921 | 103.8 | 30.99 |
| Delhi | 24177 | 110 | 59.03 | 2071.22807 | 28.5 | 199.98 |
| Gujrat | 303 | 230 | 88.16 | 1459.602649 | 60.4 | 64.79 |
| Jammu Kashmir | 2789 | 23 | 35.29 | 2823.2 | 12.5 | 55.23 |
| Karnataka | 3251 | 228 | 72.3 | 1183.306056 | 61.1 | 69.35 |
| Madhya Pradesh | 852 | 120 | 80.65 | 1110.881543 | 72.6 | 44.24 |
| Maharashtra | 3009 | 430 | 122.25 | 1087.633452 | 112.4 | 74.72 |
| Punjab | 129 | 72 | 36.38 | 1313.357401 | 27.7 | 84.32 |
| Rajasthan | 193 | 140 | 98.14 | 1430.612245 | 68.6 | 53.79 |
| Tamil Nadu | 659 | 297 | 99.76 | 1383.633842 | 72.1 | 65.68 |
| Uttar Pradesh | 60 | 240 | 189.67 | 1583.222037 | 119.8 | 38.73 |
| West Bengal | 13 | 181 | 79.21 | 867.579409 | 91.3 | 51.74 |
dfTotal['Internet Users Per 100'].plot(kind='bar',figsize=(15,10))
plt.title('Internet users per 100 of the state Population',fontsize=18 )
plt.ylabel('Internet users', fontsize=18)
plt.xticks(fontsize=14)
plt.yticks(fontsize=14)

plt.xlabel('States',fontsize=18)
# plt.savefig('internet.png')

# plt.show()
Text(0.5, 0, 'States')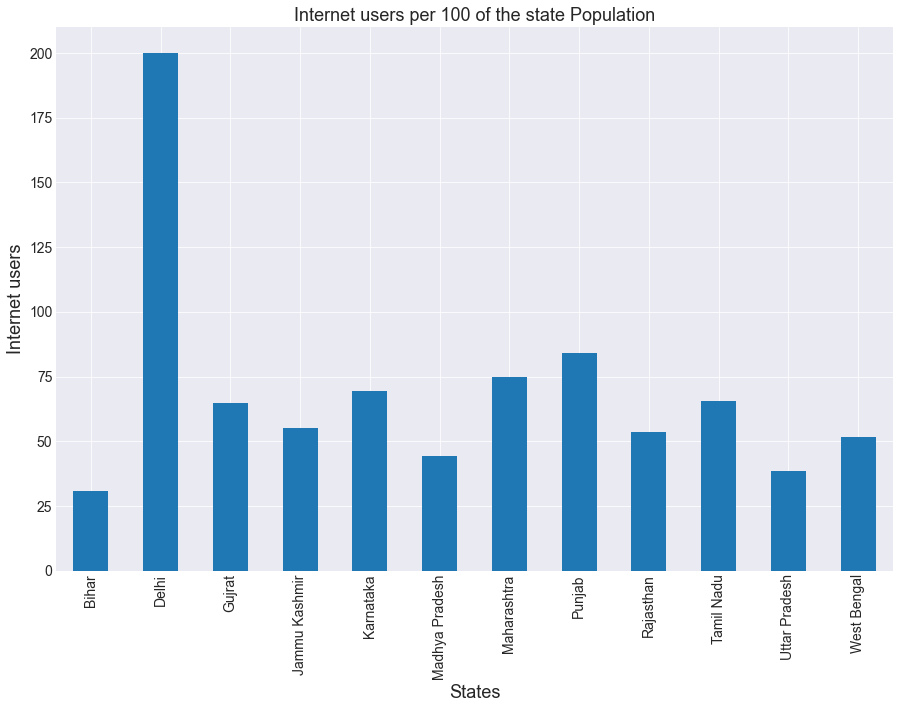
# dfTotal[['Health Care per capita','Total','Internet Users Per 100']].plot(kind='bar',figsize=(15,10))
# plt.title('HealthCare Spending,Internet Users and  No of SOS Tweets during peak of Second Wave',fontsize=18 )
# plt.ylabel('HealthCare spending, users and tweets', fontsize=18)
# plt.xticks(fontsize=14)
# plt.yticks(fontsize=14)

# plt.xlabel('States',fontsize=18)
# plt.savefig('Interentvsspendingvstweets.png')

# plt.show()
plt.rcParams.update({'font.size': 14})

ax=dfTotal[['Health Care per capita','Total','Internet Users Per 100']].plot(kind='bar',figsize=(18,10),width=0.9)
plt.title('HealthCare Spending,Internet Users and  No of SOS Tweets during peak of Second Wave',fontsize=18 )
plt.ylabel('HealthCare spending,Tweets and Internet user', fontsize=18)
plt.xticks(fontsize=20)
plt.yticks(fontsize=20)

plt.xlabel('States',fontsize=18)
plt.legend(labels=['Spending per capita','Total Tweets','Internet Users per 100'])

plt.xlabel('States',fontsize=18)
# ax.bar_label(ax.containers[0],ax.containers[1])
for c in ax.containers:
    ax.bar_label(c, fmt='%.0f', label_type='edge')
plt.tight_layout()
plt.savefig('UpdatedInterentvsspendingvstweets.jpg')

plt.show()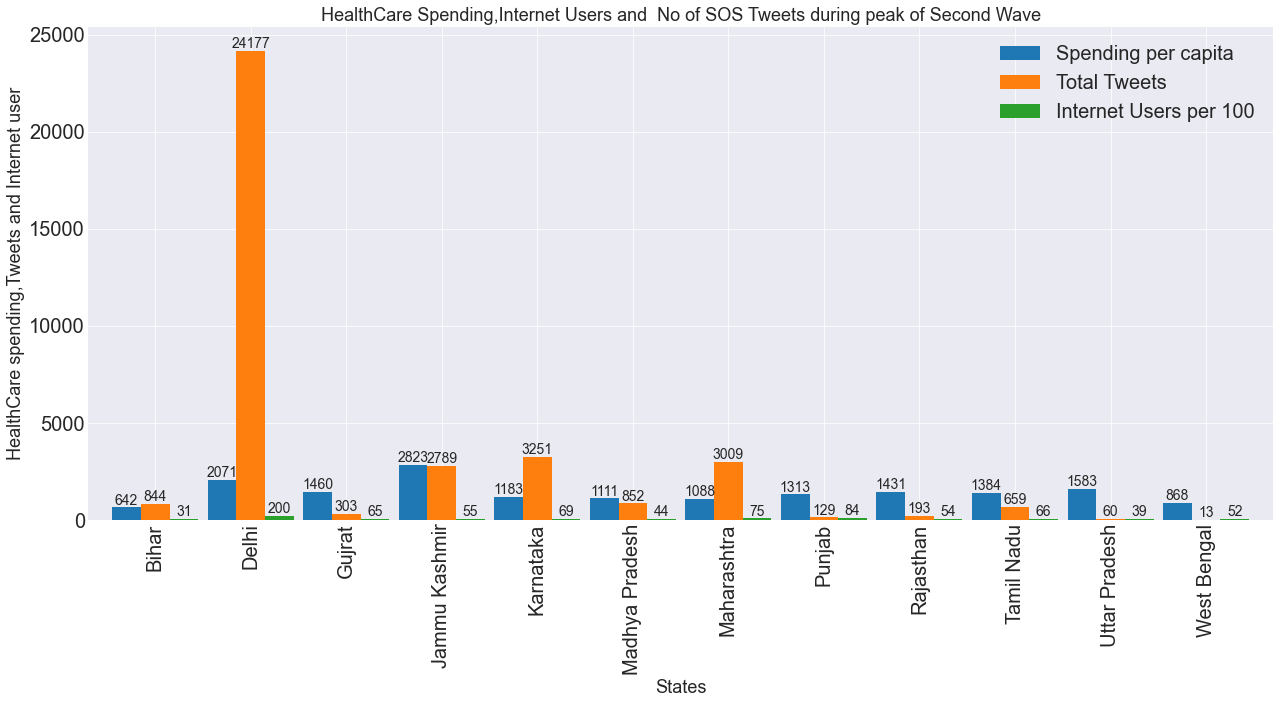
# plt.wid
dfTotal[['Total','Internet Users Per 100']].plot(kind='bar',figsize=(15,10))
plt.title('Internet Users VS  No of SOS Tweets during peak of Second Wave',fontsize=18 )
plt.ylabel('Tweets and Internet Users', fontsize=18)
plt.xticks(fontsize=14)
plt.yticks(fontsize=14)

plt.xlabel('States',fontsize=18)
# plt.savefig('Internetusersvstweets.png')

# plt.show()
Text(0.5, 0, 'States')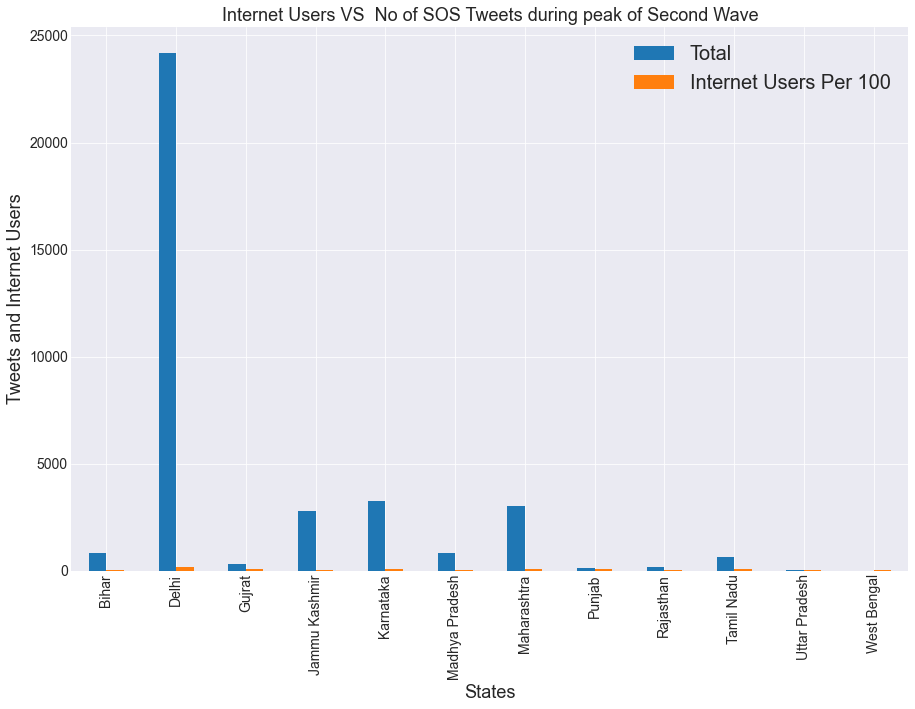
dfTotal4=dfTotal.drop('Delhi')
dfTotal4[['Total','Internet Users Per 100']].plot(kind='bar',figsize=(15,10))
plt.title('Internet Users VS  No of SOS Tweets during peak of Second Wave',fontsize=18 )
plt.ylabel('Tweets and Internet Users', fontsize=18)
plt.xticks(fontsize=14)
plt.yticks(fontsize=14)

plt.xlabel('States',fontsize=18)
# plt.savefig('Internetusersvstweets2.png')

# plt.show()
Text(0.5, 0, 'States')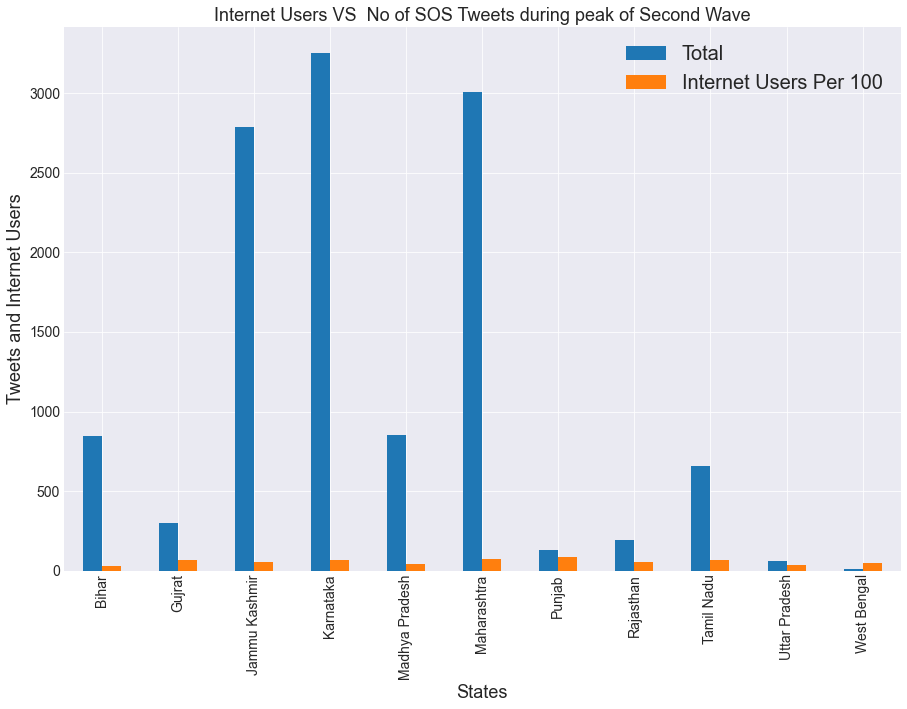
dfTotal4[['Health Care per capita','Total','Internet Users Per 100']].plot(kind='bar',figsize=(15,10))
plt.title('HealthCare Spending,Internet Users and  No of SOS Tweets during peak of Second Wave',fontsize=18 )
plt.ylabel('HealthCare spending, users and tweets', fontsize=18)
plt.xticks(fontsize=14)
plt.yticks(fontsize=14)

plt.xlabel('States',fontsize=18)
# plt.savefig('Interentvsspendingvstweets2.png')

# plt.show()
Text(0.5, 0, 'States')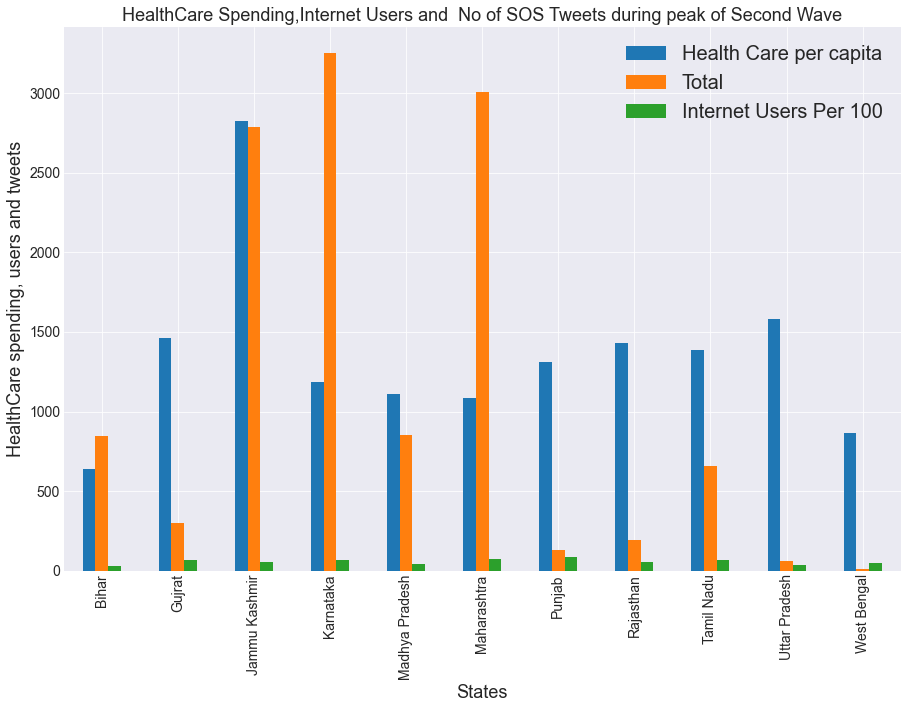
dfStates| Bihar | Delhi | Gujrat | Punjab | Rajasthan | Uttar Pradesh | West Bengal | Tamil Nadu | Jammu Kashmir | Madhya Pradesh | Maharashtra | Karnataka | |
|---|---|---|---|---|---|---|---|---|---|---|---|---|
| 0 | 0 | 0 | 0 | 0 | 0 | 0 | 0 | 0 | 0 | 0 | 0 | 0 |
| 1 | 0 | 0 | 0 | 0 | 0 | 0 | 0 | 0 | 0 | 0 | 0 | 0 |
| 2 | 0 | 0 | 0 | 0 | 0 | 0 | 0 | 0 | 0 | 0 | 0 | 0 |
| 3 | 0 | 0 | 0 | 0 | 0 | 0 | 0 | 0 | 0 | 0 | 0 | 0 |
| 4 | 0 | 0 | 0 | 0 | 0 | 0 | 0 | 0 | 0 | 0 | 0 | 0 |
| ... | ... | ... | ... | ... | ... | ... | ... | ... | ... | ... | ... | ... |
| 39096 | 0 | 0 | 1 | 0 | 0 | 0 | 0 | 0 | 0 | 0 | 0 | 0 |
| 39097 | 0 | 0 | 1 | 0 | 0 | 0 | 0 | 0 | 0 | 0 | 0 | 0 |
| 39098 | 0 | 0 | 1 | 0 | 0 | 0 | 0 | 0 | 0 | 0 | 0 | 0 |
| 39099 | 0 | 0 | 1 | 0 | 0 | 0 | 0 | 0 | 0 | 0 | 0 | 0 |
| 39100 | 0 | 0 | 1 | 0 | 0 | 0 | 0 | 0 | 0 | 0 | 0 | 0 |
39101 rows × 12 columns
dfTotal| Total | GDP | Health Care Spending | Health Care per capita | population | Internet Users Per 100 | |
|---|---|---|---|---|---|---|
| Bihar | 844 | 100 | 66.68 | 642.38921 | 103.8 | 30.99 |
| Delhi | 24177 | 110 | 59.03 | 2071.22807 | 28.5 | 199.98 |
| Gujrat | 303 | 230 | 88.16 | 1459.602649 | 60.4 | 64.79 |
| Jammu Kashmir | 2789 | 23 | 35.29 | 2823.2 | 12.5 | 55.23 |
| Karnataka | 3251 | 228 | 72.3 | 1183.306056 | 61.1 | 69.35 |
| Madhya Pradesh | 852 | 120 | 80.65 | 1110.881543 | 72.6 | 44.24 |
| Maharashtra | 3009 | 430 | 122.25 | 1087.633452 | 112.4 | 74.72 |
| Punjab | 129 | 72 | 36.38 | 1313.357401 | 27.7 | 84.32 |
| Rajasthan | 193 | 140 | 98.14 | 1430.612245 | 68.6 | 53.79 |
| Tamil Nadu | 659 | 297 | 99.76 | 1383.633842 | 72.1 | 65.68 |
| Uttar Pradesh | 60 | 240 | 189.67 | 1583.222037 | 119.8 | 38.73 |
| West Bengal | 13 | 181 | 79.21 | 867.579409 | 91.3 | 51.74 |
type(df.corr())pandas.core.frame.DataFramedfTotal['Total']=dfTotal['Total'].astype(float)
dfTotal['GDP']=dfTotal['GDP'].astype(float)
dfTotal['Health Care Spending']=dfTotal['Health Care Spending'].astype(float)
dfTotal['Health Care per capita']=dfTotal['Health Care per capita'].astype(float)
dfTotal['population']=dfTotal['population'].astype(float)
dfTotal['Internet Users Per 100']=dfTotal['Internet Users Per 100'].astype(float)# dfTotal['Total']=dfTotal['Total'].astype(float)
dfTotal.dtypesTotal float64
GDP float64
Health Care Spending float64
Health Care per capita float64
population float64
Internet Users Per 100 float64
dtype: objectdf.corr()| Tweet Id | Ahmedabad | Bangalore | Bengaluru | Bhopal | Bihar | Chennai | Delhi | GJ | JK | ... | Rajasthan | TN | Uttar Pradesh | West Bengal | Tamil Nadu | Jammu Kashmir | Madhya Pradesh | Maharashtra | Karnataka | Gujrat | |
|---|---|---|---|---|---|---|---|---|---|---|---|---|---|---|---|---|---|---|---|---|---|
| Tweet Id | 1.000000 | -0.005365 | 0.125476 | 0.044746 | 0.045548 | 0.049691 | 0.123024 | -0.235089 | 0.004306 | 0.119188 | ... | 0.009815 | 0.033697 | 0.018819 | 0.015321 | 0.127428 | 0.123227 | 0.021420 | 0.049845 | 0.134419 | -0.004592 |
| Ahmedabad | -0.005365 | 1.000000 | -0.024590 | -0.008522 | -0.009792 | -0.012950 | -0.011166 | -0.110974 | -0.001247 | -0.021767 | ... | -0.006141 | -0.002334 | -0.003418 | -0.001590 | -0.011416 | -0.024164 | -0.013013 | -0.025175 | -0.026256 | 0.986609 |
| Bangalore | 0.125476 | -0.024590 | 1.000000 | -0.027566 | -0.031673 | -0.041890 | -0.036120 | -0.358968 | -0.004035 | -0.070409 | ... | -0.019864 | -0.007550 | -0.011056 | -0.005143 | -0.036926 | -0.078162 | -0.042093 | -0.081433 | 0.936555 | -0.024924 |
| Bengaluru | 0.044746 | -0.008522 | -0.027566 | 1.000000 | -0.010976 | -0.014517 | -0.012518 | -0.124403 | -0.001398 | -0.024401 | ... | -0.006884 | -0.002616 | -0.003832 | -0.001782 | -0.012797 | -0.027088 | -0.014588 | -0.028221 | 0.324569 | -0.008638 |
| Bhopal | 0.045548 | -0.009792 | -0.031673 | -0.010976 | 1.000000 | -0.016680 | -0.014383 | -0.142939 | -0.001607 | -0.028036 | ... | -0.007910 | -0.003006 | -0.004403 | -0.002048 | -0.014704 | -0.031124 | 0.752458 | -0.032426 | -0.033819 | -0.009925 |
| Bihar | 0.049691 | -0.012950 | -0.041890 | -0.014517 | -0.016680 | 1.000000 | -0.019023 | -0.189049 | -0.002125 | -0.037081 | ... | -0.010461 | -0.003976 | -0.005823 | -0.002709 | -0.019447 | -0.041164 | -0.022168 | -0.042887 | -0.044728 | -0.013126 |
| Chennai | 0.123024 | -0.011166 | -0.036120 | -0.012518 | -0.014383 | -0.019023 | 1.000000 | -0.163009 | -0.001832 | -0.031973 | ... | -0.009020 | -0.003428 | -0.005021 | -0.002336 | 0.978169 | -0.035494 | -0.019115 | -0.036979 | -0.038567 | -0.011318 |
| Delhi | -0.235089 | -0.110974 | -0.358968 | -0.124403 | -0.142939 | -0.189049 | -0.163009 | 1.000000 | -0.018208 | -0.317529 | ... | -0.089643 | -0.034072 | -0.049897 | -0.023212 | -0.166647 | -0.352538 | -0.188881 | -0.367308 | -0.383286 | -0.112480 |
| GJ | 0.004306 | -0.001247 | -0.004035 | -0.001398 | -0.001607 | -0.002125 | -0.001832 | -0.018208 | 1.000000 | -0.003571 | ... | -0.001008 | -0.000383 | -0.000561 | -0.000261 | -0.001873 | -0.003965 | -0.002135 | -0.004130 | -0.004308 | 0.161875 |
| JK | 0.119188 | -0.021767 | -0.070409 | -0.024401 | -0.028036 | -0.037081 | -0.031973 | -0.317529 | -0.003571 | 1.000000 | ... | -0.017583 | -0.006683 | -0.009787 | -0.004553 | -0.032687 | 0.900808 | -0.035769 | -0.071267 | -0.075179 | -0.022062 |
| Kashmir | 0.033144 | -0.009873 | -0.031935 | -0.011067 | -0.012716 | -0.016819 | -0.014502 | -0.144123 | -0.001620 | -0.028269 | ... | -0.007975 | -0.003031 | -0.004439 | -0.002065 | -0.014826 | 0.408579 | -0.016900 | -0.032695 | -0.034099 | -0.010007 |
| MH | 0.028098 | -0.004234 | -0.013696 | -0.004747 | -0.005454 | -0.007213 | -0.006220 | -0.061812 | -0.000695 | -0.012124 | ... | -0.003420 | -0.001300 | -0.001904 | -0.000886 | -0.006358 | -0.013459 | -0.007248 | 0.168192 | -0.014624 | -0.004292 |
| MP | -0.019765 | -0.008568 | -0.027716 | -0.009605 | 0.010287 | -0.014596 | -0.012586 | -0.123457 | -0.001406 | -0.022297 | ... | -0.006921 | -0.002631 | -0.003853 | -0.001792 | -0.012867 | -0.025193 | 0.658444 | -0.020488 | -0.029593 | -0.008685 |
| Mumbai | 0.010976 | -0.014277 | -0.046181 | -0.016004 | -0.018389 | -0.024321 | -0.020971 | -0.208082 | -0.002342 | -0.039514 | ... | -0.011533 | -0.004383 | -0.006419 | -0.002986 | -0.021439 | -0.044134 | -0.018946 | 0.567099 | -0.049309 | -0.014470 |
| Pune | 0.047361 | -0.019682 | -0.063667 | -0.022064 | -0.025352 | -0.033530 | -0.028912 | -0.287327 | -0.003229 | -0.056357 | ... | -0.015899 | -0.006043 | -0.008850 | -0.004117 | -0.029557 | -0.062563 | -0.031246 | 0.781831 | -0.067980 | -0.019950 |
| Punjab | 0.054141 | -0.005016 | -0.016226 | -0.005623 | -0.006461 | -0.008545 | -0.007368 | -0.073228 | -0.000823 | -0.014363 | ... | -0.004052 | -0.001540 | -0.002255 | -0.001049 | -0.007533 | -0.015945 | -0.008587 | -0.016612 | -0.017325 | -0.005084 |
| Rajasthan | 0.009815 | -0.006141 | -0.019864 | -0.006884 | -0.007910 | -0.010461 | -0.009020 | -0.089643 | -0.001008 | -0.017583 | ... | 1.000000 | -0.001885 | -0.002761 | -0.001284 | -0.009221 | -0.019519 | -0.010512 | -0.020336 | -0.021209 | -0.006224 |
| TN | 0.033697 | -0.002334 | -0.007550 | -0.002616 | -0.003006 | -0.003976 | -0.003428 | -0.034072 | -0.000383 | -0.006683 | ... | -0.001885 | 1.000000 | -0.001049 | -0.000488 | 0.204456 | -0.007419 | -0.003995 | -0.007729 | -0.008061 | -0.002366 |
| Uttar Pradesh | 0.018819 | -0.003418 | -0.011056 | -0.003832 | -0.004403 | -0.005823 | -0.005021 | -0.049897 | -0.000561 | -0.009787 | ... | -0.002761 | -0.001049 | 1.000000 | -0.000715 | -0.005133 | -0.010865 | -0.005851 | -0.011319 | -0.011805 | -0.003464 |
| West Bengal | 0.015321 | -0.001590 | -0.005143 | -0.001782 | -0.002048 | -0.002709 | -0.002336 | -0.023212 | -0.000261 | -0.004553 | ... | -0.001284 | -0.000488 | -0.000715 | 1.000000 | -0.002388 | -0.005054 | -0.002722 | -0.005266 | -0.005492 | -0.001612 |
| Tamil Nadu | 0.127428 | -0.011416 | -0.036926 | -0.012797 | -0.014704 | -0.019447 | 0.978169 | -0.166647 | -0.001873 | -0.032687 | ... | -0.009221 | 0.204456 | -0.005133 | -0.002388 | 1.000000 | -0.036286 | -0.019541 | -0.037805 | -0.039428 | -0.011571 |
| Jammu Kashmir | 0.123227 | -0.024164 | -0.078162 | -0.027088 | -0.031124 | -0.041164 | -0.035494 | -0.352538 | -0.003965 | 0.900808 | ... | -0.019519 | -0.007419 | -0.010865 | -0.005054 | -0.036286 | 1.000000 | -0.040001 | -0.079275 | -0.083457 | -0.024492 |
| Madhya Pradesh | 0.021420 | -0.013013 | -0.042093 | -0.014588 | 0.752458 | -0.022168 | -0.019115 | -0.188881 | -0.002135 | -0.035769 | ... | -0.010512 | -0.003995 | -0.005851 | -0.002722 | -0.019541 | -0.040001 | 1.000000 | -0.037836 | -0.044944 | -0.013189 |
| Maharashtra | 0.049845 | -0.025175 | -0.081433 | -0.028221 | -0.032426 | -0.042887 | -0.036979 | -0.367308 | -0.004130 | -0.071267 | ... | -0.020336 | -0.007729 | -0.011319 | -0.005266 | -0.037805 | -0.079275 | -0.037836 | 1.000000 | -0.086950 | -0.025517 |
| Karnataka | 0.134419 | -0.026256 | 0.936555 | 0.324569 | -0.033819 | -0.044728 | -0.038567 | -0.383286 | -0.004308 | -0.075179 | ... | -0.021209 | -0.008061 | -0.011805 | -0.005492 | -0.039428 | -0.083457 | -0.044944 | -0.086950 | 1.000000 | -0.026612 |
| Gujrat | -0.004592 | 0.986609 | -0.024924 | -0.008638 | -0.009925 | -0.013126 | -0.011318 | -0.112480 | 0.161875 | -0.022062 | ... | -0.006224 | -0.002366 | -0.003464 | -0.001612 | -0.011571 | -0.024492 | -0.013189 | -0.025517 | -0.026612 | 1.000000 |
26 rows × 26 columns
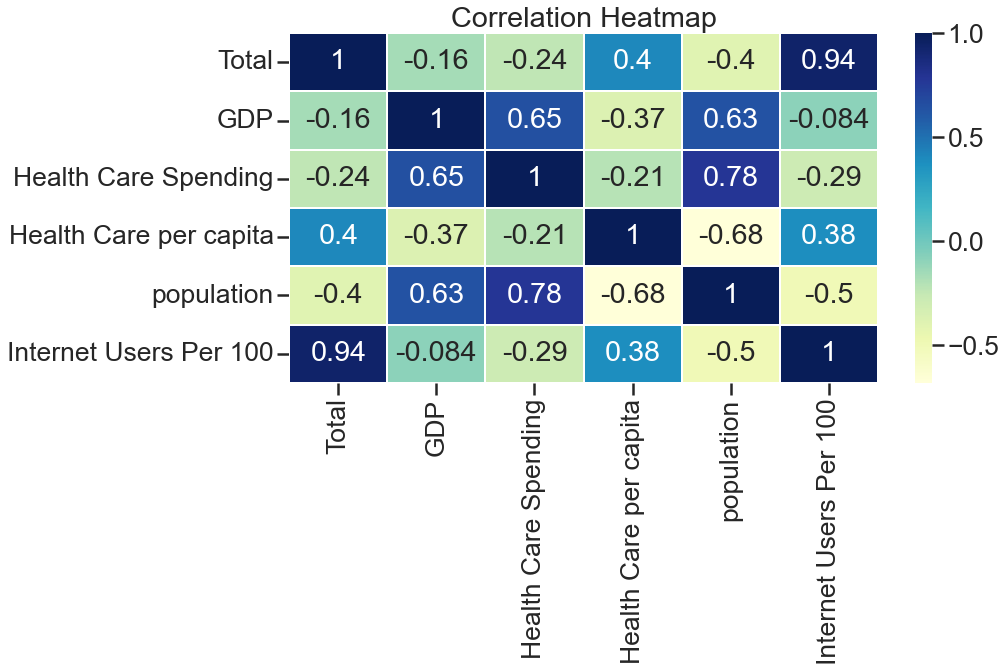
import matplotlib.pyplot as plt
plt.figure(figsize = (15,10))
plt.title('Correlation Heatmap')
ax = sns.heatmap(dfTotal.corr(), cmap="YlGnBu", annot=True,linewidths=2)
sns.set_context("poster",font_scale=1.2)
plt.tight_layout()

plt.savefig('Correlationheatmap.jpg')

plt.show()